Drawings and models are the traditional means whereby an architect depicts to his client where a building might be put, how it might look and what the details of design and construction might be. The method is satisfactory but basically inflexible; if the architect or the client wants to see how he building would look in a different setting or orientation or with different details, new drawings and models must be made, at a considerable cost in time and money. Imagine, then, the benefits of a scheme that would quickly produce color pictures showing a prospective building in different places and perspectives, portraying, for example, how a new library on a college campus would look as one approached it on foot from various directions. Employing computer-generated graphic displays, my colleagues and I at the Cornell University College of Architecture, Art and Planning, in cooperation with the Visual Simulation Laboratory of the General Electric Company, have been working with a program that produces just such pictures. With further modifications, additional data and new plotting equipment the system would also be capable of rapidly printing detailed architectural drawings.
Our basic problem was one that artists have confronted since drawing began: How does one portray a three-dimensional scene on a two-dimensional surface? In Western cultures the early attempts to solve this problem entailed employing such standard cues of depth as the overlapping of surfaces and the fact that the size of a known object in a picture is inversely proportional to its distance from the observer. Artists have also developed such conventions as putting closer objects in the bottom foreground and making receding lines oblique.
Not until the Renaissance was the art of perspective drawing thoroughly investigated. The masters of the Florentine school produced many paintings in which perspective geometry was conveyed accurately and realistically. The usual technique was to have in the painting a single vanishing point, that is, a point where receding lines representing parallels seem to meet.
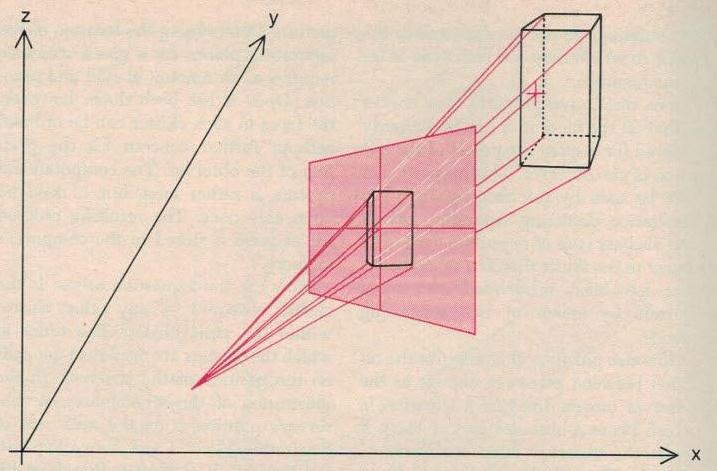
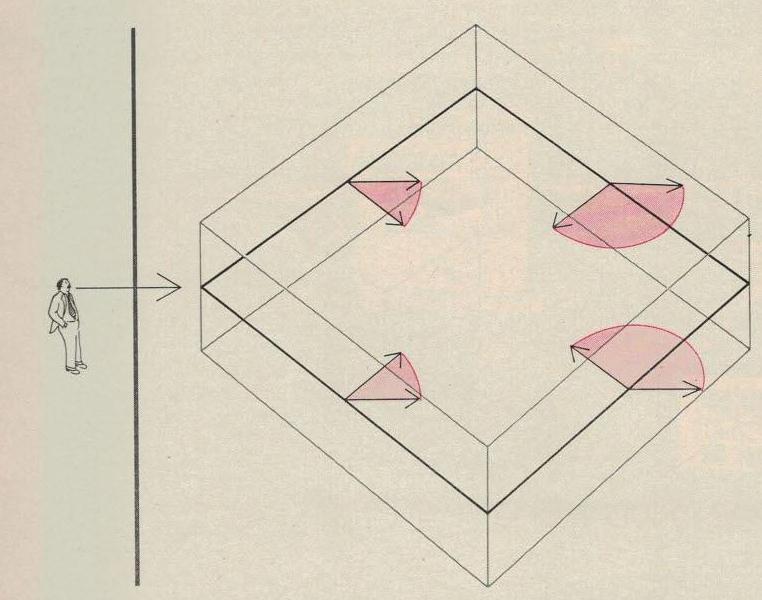
Today it is possible to derive this kind of visual logic mathematically and to instruct a computer to draw the perspective images. Consider an observer looking at a rectangular three-dimensional object [Figure 4]. The hypothetical lines from his eye to various points on the object constitute a bundle of view rays. The perspective drawing is constructed by determining the intersections of the view rays with an imaginary picture plane and connecting the appropriate points. The result is a two-dimensional image of the object projected on the picture plane.
A number of mathematical methods exist for computing a perspective image of an object composed of straight lines. They all require that a complete three-dimensional description of the object be stated in the form of the geometric coordinates of each vertex on the object. The frame of reference for the coordinates is a set of three axes (designated x, y and z) emanating from an arbitrary point and forming right angles with one another. The relation of the axes is what one would find in the lines emanating from a corner of a cube: a vertical line and two horizontal lines. Procedures for programming a computer to create the perspective image rely variously on solid geometry, vector equations and matrix transformations.
At present the commonest approach is to transform the mathematical quantities describing the observer, the object and the plane of the picture into a single coordinate system. The viewer is the origin, and the orthogonal axes are parallel to the picture plane and to the line of sight. By this means the intersection of the view rays with the picture plane can be computed readily by ratios derived from the geometry of similar triangles.
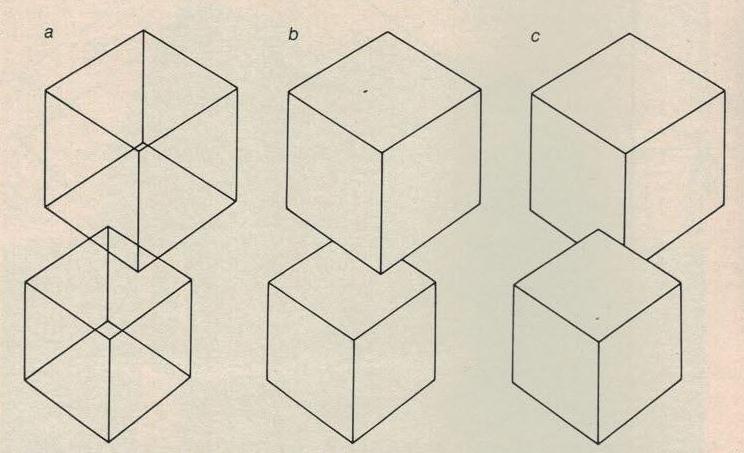
When all the lines of the object are drawn between their analogous points on the picture plane, the result is a wire line drawing [Figure 5.]. This type of two-dimensional representation is confusing unless the hidden lines are removed. They are the lines the observer would not see in the three-dimensional object. Once the computer has been given the complex instructions on what it cannot see, causing it to remove the hidden lines, more readable drawings can be generated.
Drawings of this kind are usually obtained from the computer by means of a plotter in which the machine controls the motion of the pen or the paper or both. An electrostatic printer-plotter is another output device, which can produce both line drawings and halftone pictures similar to the ones yielded by photocopying machines. Still other devices for graphic output are the cathode ray tube and the television screen.
The most realistic graphic result is obtained with a color television set as the output device. This process was introduced by the Visual Simulation Laboratory of General Electric for simulation procedures designed to train astronauts for clocking maneuvers in space. The abstract images were displayed 30 times per second, which is the rate of repetition of the picture on an ordinary television set and was rapid enough to simulate continuous movement.
For architectural purposes such speed is not necessary. With less frequent displays highly complex and detailed images can be constructed and filmed as a motion picture, thereby creating in the viewer a sense of walking toward a building or among a group of buildings. To demonstrate this capability our group produced two years ago, with the General Electric facility, a motion picture in color depicting the evolution over a period of time (future as well as past) of the Arts Quadrangle at Cornell. Most of the photographs accompanying this article are taken from the film.
In contrast to the kind of representation made by wire-line drawings the basic element for our system is the opaque plane. Lines are visible on the television screen only as the edges of two planes of different color. Since all the planes painted on the screen are opaque, the hidden-line problem becomes how to establish the proper sequence for displaying the planes. If as an observer looked at a building one plane obscured another plane or part of it, the obscured plane should be put on the screen first. In other words, the chronological ordering of the successive layers of the image is from background to foreground.
A plane in such a situation can be described as a polygonal face that is either opaque or transparent to an observer, that is, he can see it or he cannot. For the computer the polygon is defined geometrically by its vertexes, and its color is identified by a particular number. Our convention was to put the vertexes describing a plane into the computer in a clockwise sequence when the plane was viewed from the opaque side and in a counterclockwise sequence when the plane was viewed from the transparent side. The computer treated the planes accordingly as opaque or transparent.
A plane or a face may also have subfaces that are contained entirely within the plane. Doors and windows are examples. The computations that determine when that plane should be portrayed in the sequence also serve for its subfaces, provided that each subface is painted over its parent plane.
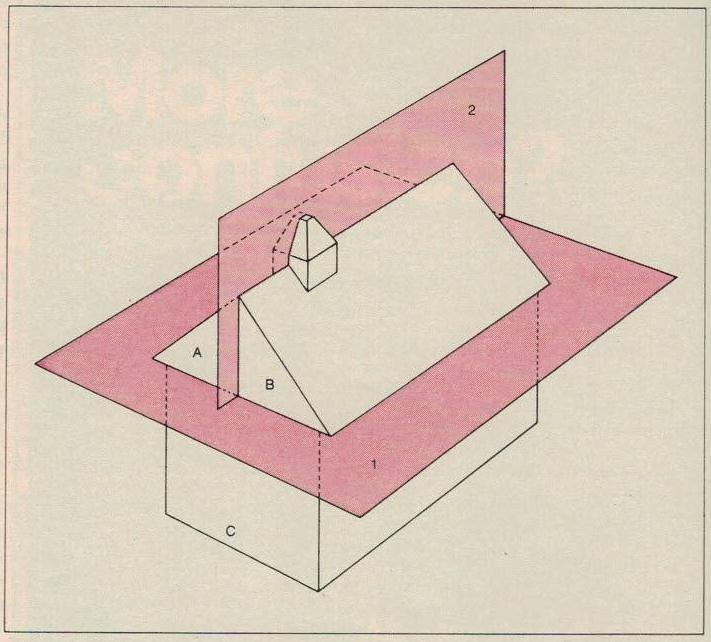
The setting for a prospective building is likely to contain several objects, including existing buildings and parts of buildings and a certain amount of terrain. If in a complex setting it is impossible to determine the order in which the faces of an object should be painted, the object must be further subdivided into clusters by means of separating planes [Figure 7]. The planes establish a logic that serves the computer in determining the sequence of painting clusters. Within each cluster the sequence of painting the faces is unambiguous.
If the images are to be realistic, the computer must be given instructions for solving the hidden-plane problem. The mathematics for such a program are fairly complicated. In essence what the program must do is enable the computer to answer four categorical questions.
The first question is whether or not the plane is visible by itself. In answering the question the computer calculates the perpendicular to the surface of the plane. If the angle between the perpendicular and the direction of view is acute, the plane is visible [Figure 6]. If the angle is obtuse, the plane is not visible.
The second question is whether or not the plane is obscured by any other plane within the same cluster. If it is, the obscured plane is painted first, even if it is only partly obscured. On other occasions, as when one is looking toward a corner of a rectangular building, the two visible planes (the two visible sides of the building) do not overlap, and so the order in which they are displayed is inconsequential.
The distinctive property of a cluster is that all faces in it can be properly ordered for display regardless of the position of the observer. This property can best be seen by referring again to the illustation depicting separating planes [Figure 7.]. The object in the illustration is a schoolhouse that has been subdivided into three clusters by means of two separating planes.
It is also possible, of course, for the relation between planes to change as the observer moves. Imagine a situation in which Plane A obscures part of Plane B when the observer is in one position, whereas Plane B obscures part of Plane A when the observer moves to a different place. In this case it is impossible to order the sequence of display on the basis of nothing more than the geometry of the object, since the sequence also depends on the position of the observer. Here a separating plane is devised to eliminate the ambiguity.
I should emphasize that separating planes and clusters are concepts, not real objects; their purpose is to make it possible for a computer to display plane faces in a sequence that yields a realistic picture. Determining the location of the separating planes for a given structure requires a fair amount of skill and practice. Once it has been done, however, the faces in each cluster can be ordered without further concern for the position of the observer. The computational process is rather long, but it need be done only once. The resulting ordered list of faces is stored in the computer's memory.
Now the third question arises: Is the cluster obscured by any other cluster within the same object? The order in which the clusters are displayed depends on the position of the observer. In the illustration of the schoolhouse the observer's position is on the near side of Separating Plane 1 and above Separating Plane 2. It is evident that from his perspective Cluster B will obscure parts of Cluster A and Cluster C and Cluster A will obscure part of Cluster C. Since the order of display is from background to foreground, the sequence of painting the clusters for the schoolhouse is C, A and B.
The final question is whether or not the object is obscured by any other object. It therefore concerns the order in which objects are displayed. Usually objects are separate (two buildings, for example), so that one can deal with them by means of range points. Each object is arbitrarily given a range point. The order in which the objects are displayed is then determined by their distance from the observer. The objects farthest away will be painted first, and the closest ones will be painted last.
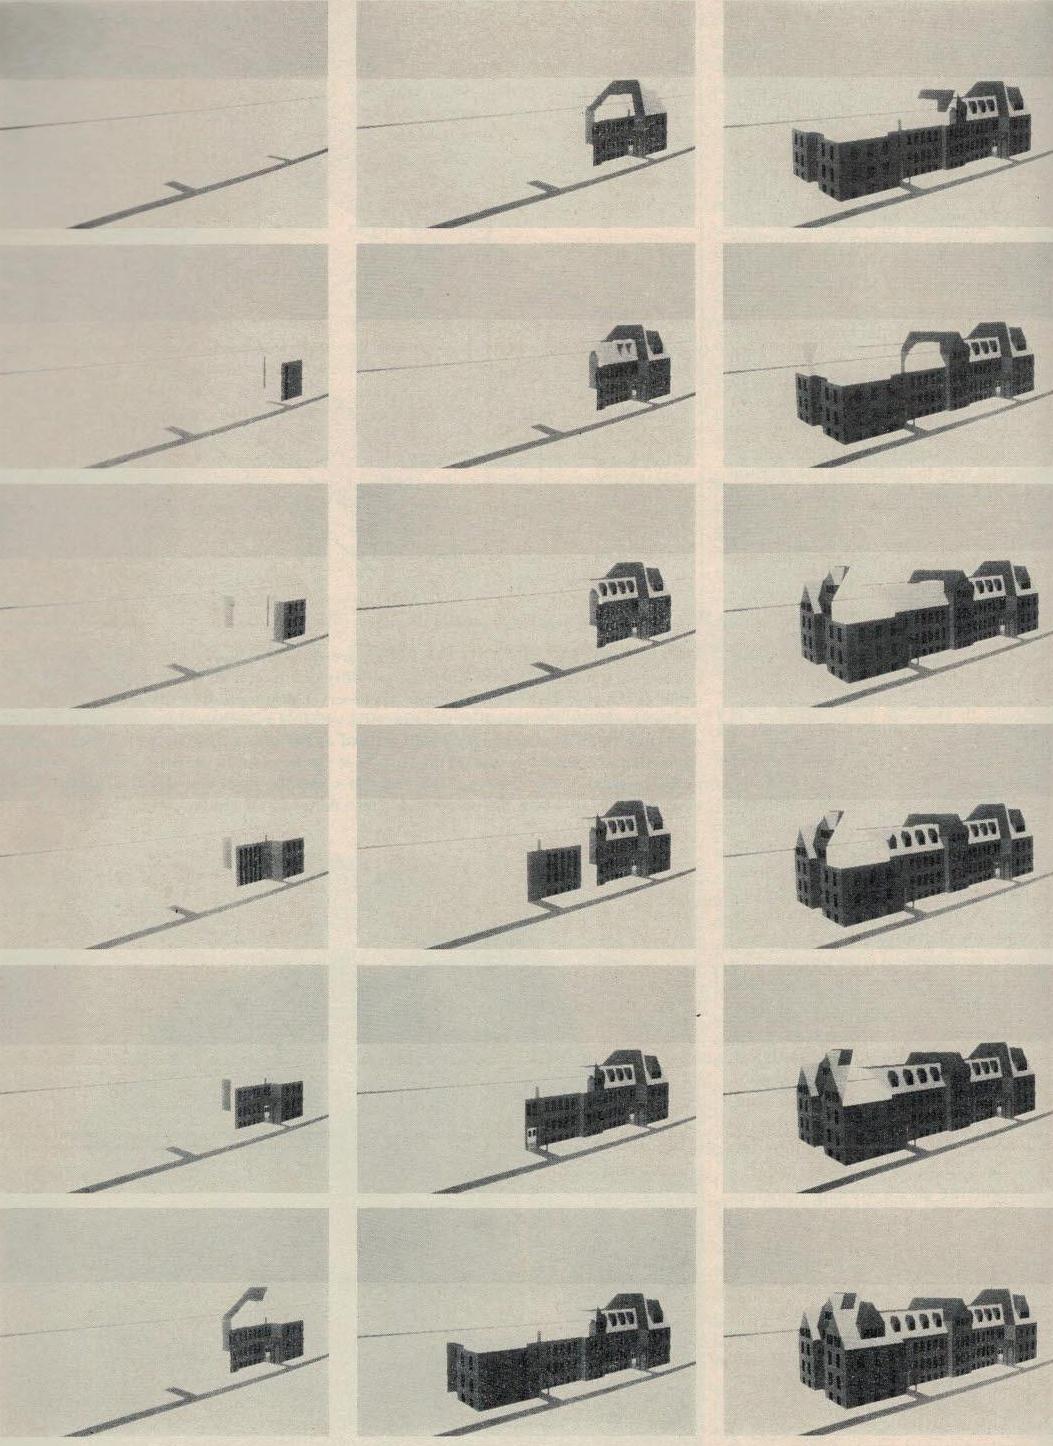
Once the perspective transformations and the sequence for displaying images have been established for a particular scene, the picture can be formed on the television screen. The computer can control the generation of the picture in such a way that each dot or raster on the screen will be given the appropriate color. The accompanying series of photographs [Figure 9.] shows how an image is built up. The time needed for the computer to generate the finished image is about two seconds.
A major advantage of this approach is that it can compute the portion of the priority list that is dependent on the geometry of the object and independent of the position of the observer. These are the calculations performed in solving the relations among planes within clusters. As a result a substantial part of the computational work is done before the picture is generated.
Recent studies by workers at General Electric and by others, notably Ivan E. Sutherland and his colleagues at the University of Utah, have brought advances in computer displays. One improvement has increased the efficiency and versatility with which halftone images can be generated. Another has created smooth shading techniques, which eliminate hard edges so that rounded polygonal surfaces can be made to appear rounded in the display. Programs for depicting illumination, shading and shadowing, transparency and the reflection of light have been developed. Graphic devices giving higher resolution and therefore clearer pictures are being tested.
For architecture the rapid improvement in the technology of graphic display promises a number of benefits beyond being able to show how a building will look in its setting and to simulate a walk through the scene by an observer. For example, if information is stored in the computer's memory on specific features of the design, on geometric descriptions of architectural details, on standard components such as windows and on estimating costs, it will be easy for the machine to generate both working drawings and cost surveys. Moreover, given programs for spatial evaluation or for structural and mechanical analysis, the machine will be able to serve as an interacting partner in the design process.
The typical stages of an architectural design process are schematic design, in which floor plans are roughly sketched; preliminary design, in which the elements of the plan are assembled into a representation of the completed building, and final design, which includes working drawings and models. In the first two stages interactive computer processes are already available. Nicholas P. Negroponte of the Massachusetts Institute of Technology has been working on sketch-recognition techniques, which enable the designer to doodle with plans and have his intentions interpreted correctly by the machine. The firm of Perry, Dean and Stewart in Boston employs computer graphic displays in an interactive way to determine the relation the various parts of a building should have to one another. The Chicago office of Skidmore, Owings & Merrill has a computer arrangement that prints out representations of the city's downtown Loop area; the firm can utilize the pictures in preliminary design studies.
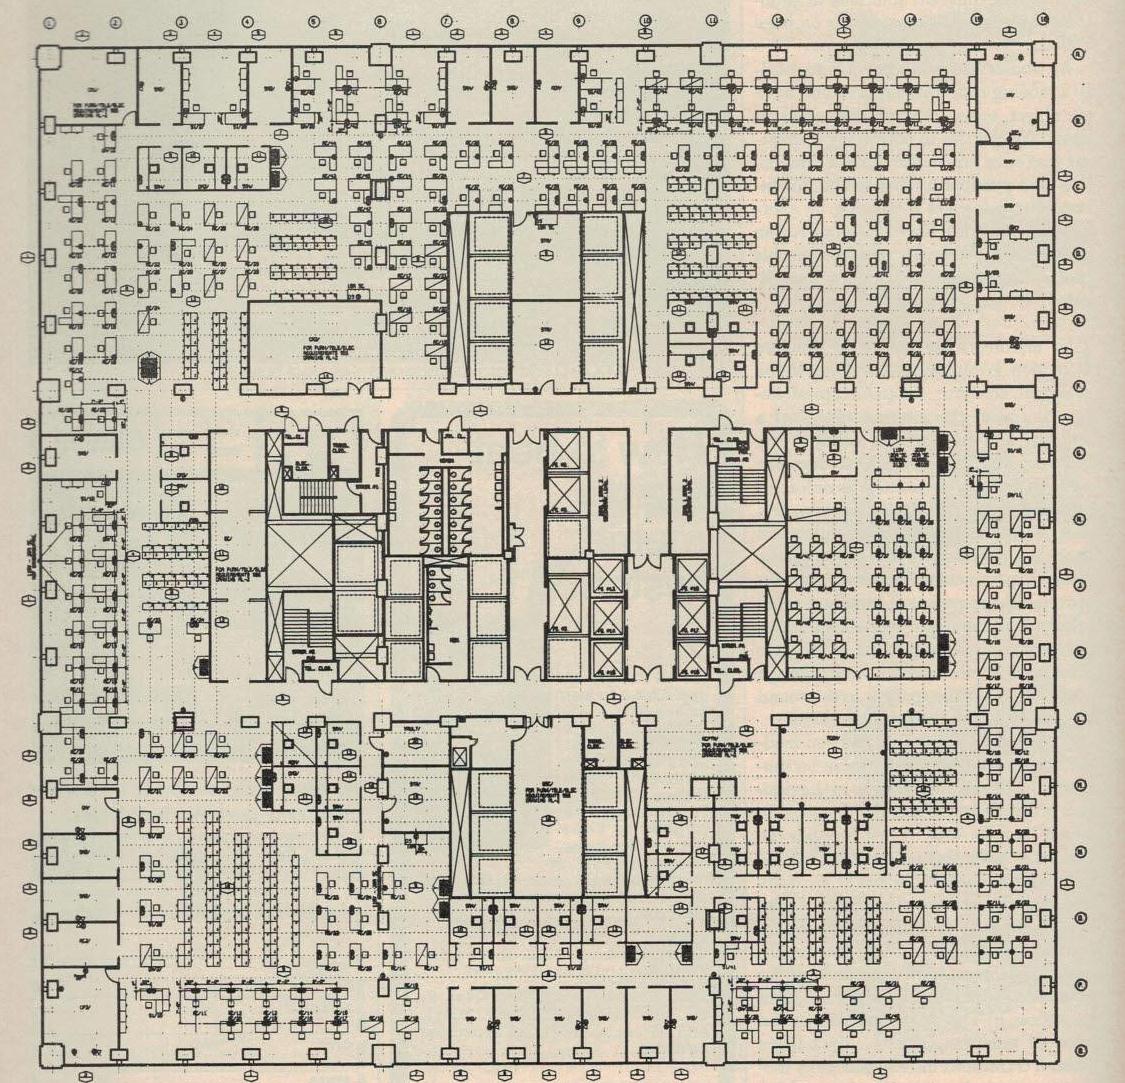
Computer-based drafting and graphic displays of other types have proved to be accurate, economical and rapidly producible. As a result their contributions to architecture have been increasing. An example is a machine-based drafting system employed by Saphier, Lerner, Schindler, Environetics, Inc., of New York to generate all the interior-design drawings for the Sears Tower in Chicago. Four separate plans (for construction, for the reflected ceilings, for finishing and for furniture, telephone and electric arrangements) were prepared for each of the 110 stories [Figure 10.]. The large amount of repetition from one floor to the next made this computer operation particularly advantageous. The most complicated plan, which might ordinarily take one manweek of drafting time, was done by the machine in 45 minutes. The firm has found the system so effective that it is now producing all its working drawings in this way.
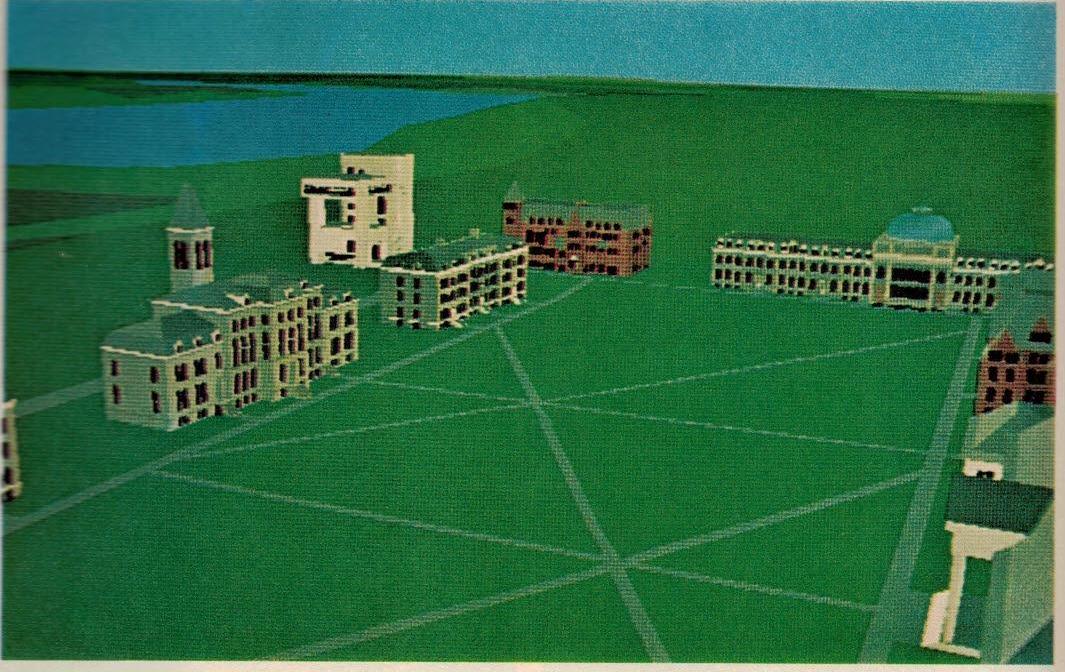
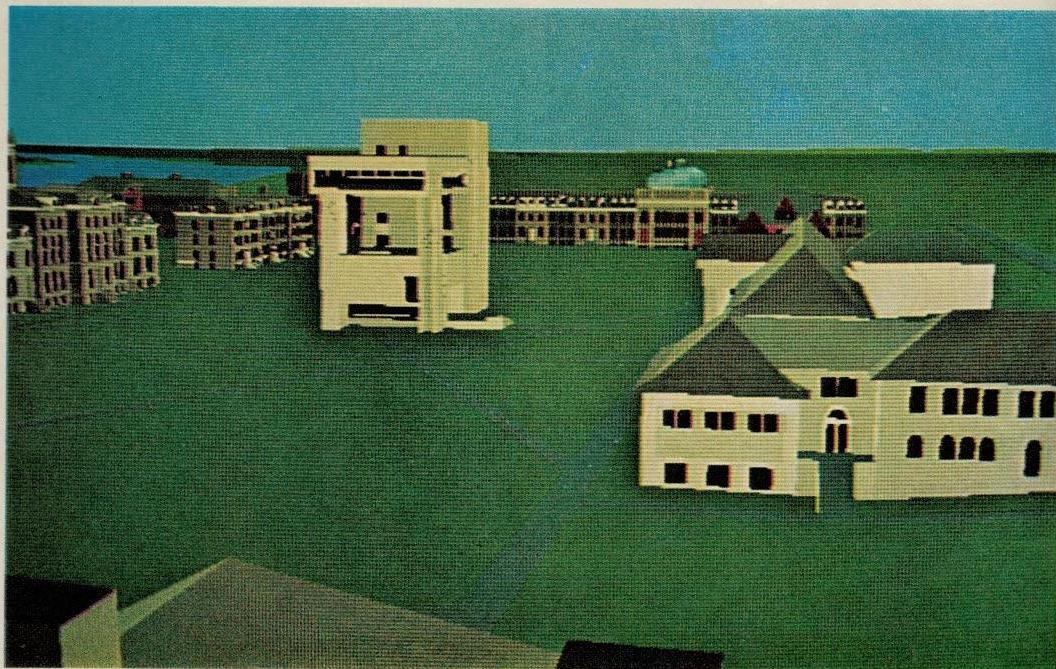
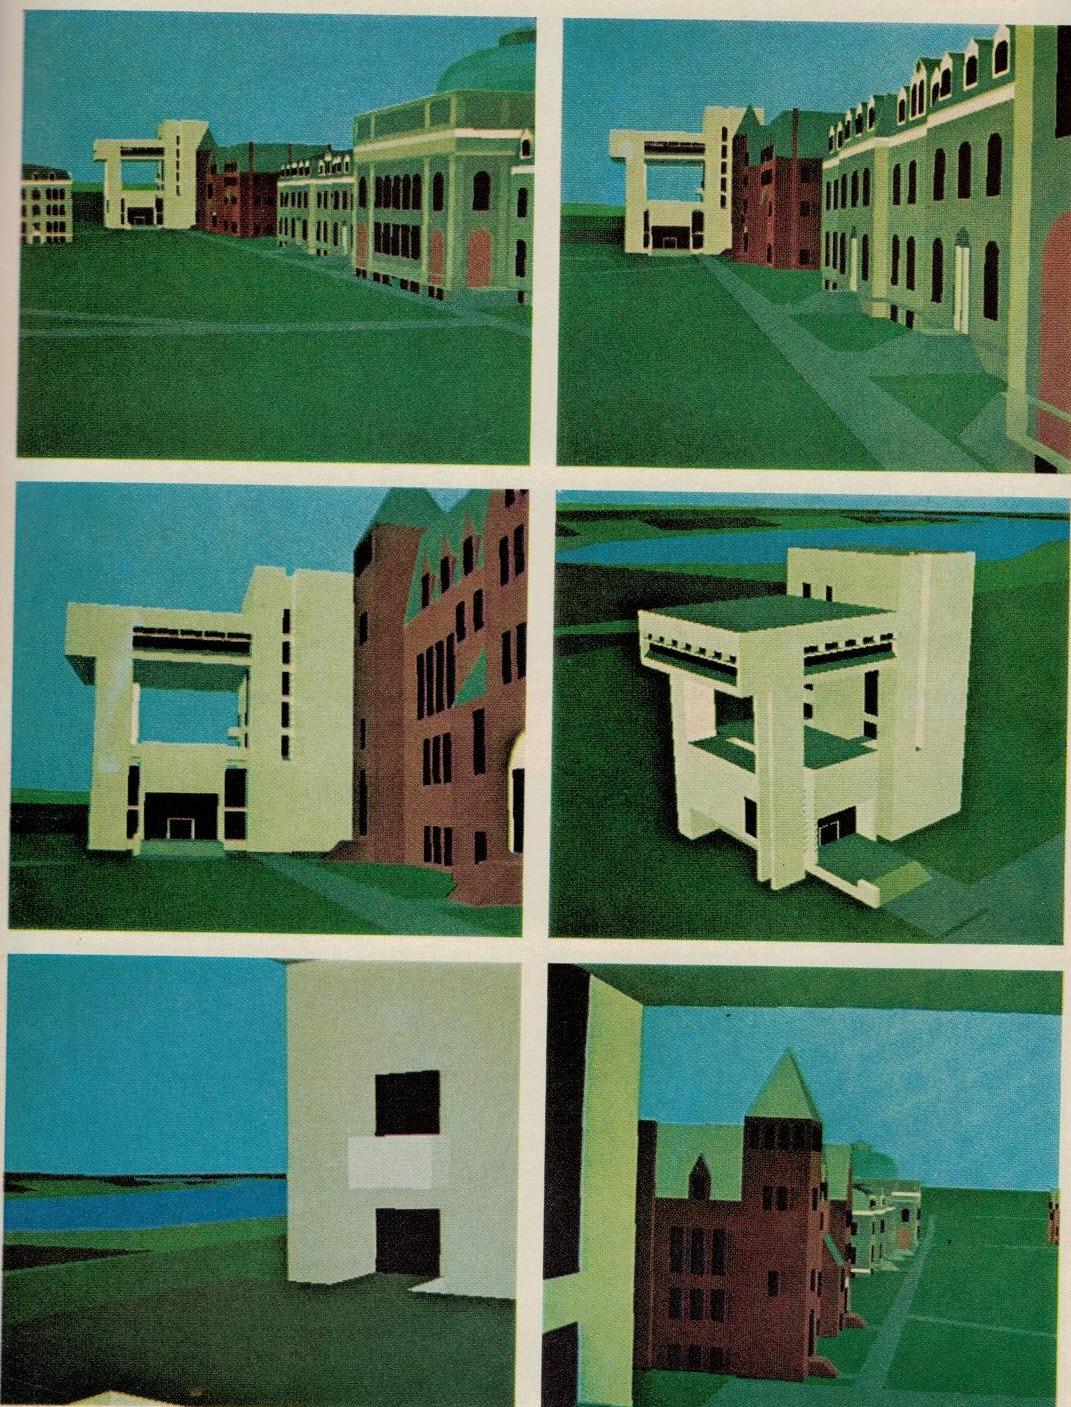
A system that produces computer-generated images in color offers three major advantages over the standard architectural drawings and models. They are flexibility in changing the design, the ability to simulate motion and the opportunity to change and experiment with color. These advantages are evident in the accompanying photographs [Figure 1.] relating to the construction of the Herbert F. Johnson Art Museum at Cornell. To cause the computer to generate the images, each building and object in the environment (the museum is on the periphery of the Arts Quadrangle) was mathematically modeled in its own three-dimensional coordinate system.
If for the coordinate system of each object the coordinates of the origin and orientation of the axes are known, then by means of the appropriate translations and rotations the data can be combined into one general system representing the environment of the buildings and objects. The advantage of this hierarchical structure of coordinate data is that one can then vary the site of each building easily, thereby testing with the computer a variety of different solutions to problems of design [Figure 2.] [Figure 3.].
By similar means it is possible to specify a moving coordinate system and have an object move through the environment. We did this in portraying a streetcar that once ran on the Cornell campus. It is also possible to change the dimensions or the scale of a building by altering the numerical input relating to the geometry of the building, although this procedure is somewhat more complicated.
For architects the ability to simulate motion is highly useful. One of the principal concerns of architectural design is space: the internal spaces of a building and the external space of the building and its setting. One does not react to space from a static position, as one might view a painting. To obtain a deeper understanding of architectural space it is necessary to move through the space, experiencing new views and discovering the sequence of complex spatial relations. By filming a sequence of computer-generated images one can obtain a realistic simulation of a walk through a space, even if the space is in or around a building that has not yet been built.
Once the environment has been modeled mathematically, motion can be simulated by describing changes in the position of the observer and the direction in which he is looking. If one supplies the computer with this information for the starting and finishing points of the walk and with the total number of images desired from start to finish, the computer can do the rest, calculating the coordinates of each position occupied by the imaginary stroller and the direction of view from it. This procedure will yield a walk of constant velocity. To achieve smooth transitions instead of a jerky motion, particularly at the starting and finishing points, one can supply the computer with acceleration functions that can increase or decrease the simulated velocity as desired.
Since each color can be identified mathematically, the sytem enables the architect to experiment with color. All faces of the resulting image with the same number will be displayed in the same color. The intensity, hue and saturation of each color can be varied by controlling the components of red, green and blue light in the display. A six-bit code can specify up to 64 different colors for any particular scene by assigning two digits each to the three color components.
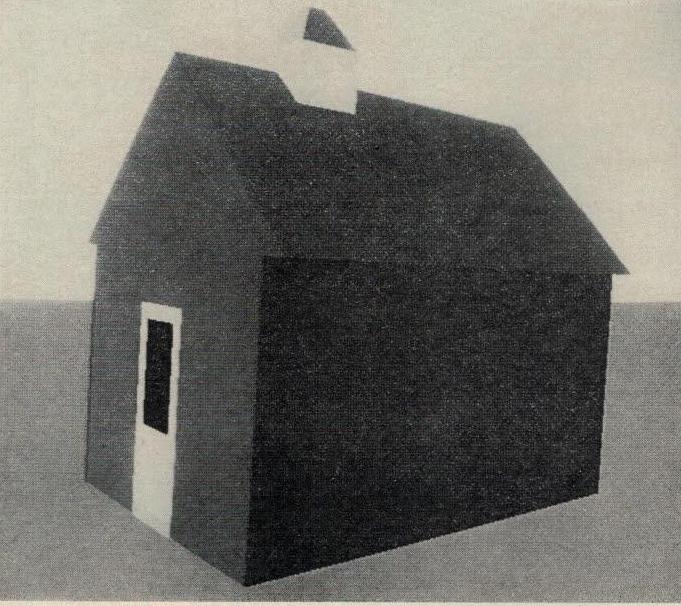
A further refinement that is available but was not included in our project is to have the machine compute the particular colors. Suppose the exterior of a proposed building is to consist of one textured material, say a gray concrete. A range of gray shades can be assigned the numbers 1 through 10, which is a sufficiently large range to provide for a considerable variation in the display. For generating pictures a specific shade will be given each plane in the image according to the angle between the sun and the perpendicular to the plane. Therefore all faces of the building can be shaded automatically by the machine.
We foresee that as the availability of computer graphic systems continues to increase and their cost continues to decrease, the process will be employed increasingly in architecture both as a medium of presentation and as a means for generating design drawings. Even more important is the potential of computer-generated images as a tool for design and analysis. The ability to test an environment before it is created is of great benefit to architecture and planning. The techniques for doing so are only now beginning to be explored.