A FORTRAN-coded version of my EXPLOR lanuae (for the production of images from explicit patterns, local operations and randomness) has been used to teach comuter graphics and computer art to a collect1on of undergraduate students in art and computer science at the University of California at Santa Cruz. My conclusions are (1) that this particular language makes it possible for relatively inexperienced programmers readily to produce a wide variety of interesting designs, (2) that a rather significant scope and quality of computer graphics can be done with simply a line printer as the output device (other equipment became available during the program) and (3) that teaching of the important concepts of computing can be facilitated by the use of graphic output - i.e. graphics can be considered an effective approach to computing as well as vice versa.
During the past year I had the opportunity to organize and to teach a course in computer graphics and computer art to a collection of art and computer science majors at the University of California at Santa Cruz. It was a varied bunch: 39 students in all, from a variety of backgrounds. One-third of them had no experience whatever with computers, one-third had some acquaintance with the field, and one-third were computer science majors.
The language used to provide personal programming experience in the area, with an emphasis on the production of interesting designs, was my own EXPLOR [Knowlton, 1970], which is a system for producing a wide variety of designs from explicitly provided 2-D patterns, local neighborhood operations, and randomness. It builds and stores plctures in raster-scan format, with an eight-bit number retaining information pertaining to each x,y coordinate position. It is a 2-dimensional language only insofar as one of the inputs to the program may be cards on which successive rows of 2-dimensional input patterns are punched. For purposes of the course, the system was reimplemented in FORTRAN and run on an IBM 360/40; 1t should be easily exportable to any medium size installation with FORTRAN capabilities. (Those interested should write to Harry Huskey, Department of Information and Computer Science, University of California at Santa Cruz, Santa Cruz, California.) A complete programmer's description of this language is provided in the appendix of this paper.
The major output device was a standard 132-character line printer. Most output from homework assignments and individual projects was printed 8 lines to the inch vertically, using white unlined paper, overprinted up to three times per line in order to obtain a fairly dark spot in a character position. Also available was an x,y plotter and, later in the program,a PDP11 based system which was being developed for ultimate use as a four-terminal interactive time-sharing system, each station consisting of a Teletype and a Tektronix 611 storage tube. A few of the more advanced students did get involved with the latter equipment. In this paper, I choose, however, to report and demonstrate the output produced simply by the line printer, in order to show that to a very significant degree computer graphics can be taught without the use of exotic display equipment. Therefore everything demonstrated in the accompanying figures is within the reach of even the more modest computer setups.
Line printer output was in many cases only an intermediate stage for many of the works produced. In the simpler treatments it was mounted, and sometimes colored - by the numbers - and displayed; more commonly it was photographed, leading ultimately to photo silk screens, photolithographs, etchings, or movies. In other cases, the design served as a model or plan for some sort of craftsmanship: latched rugs, cross-stitching or other embroidery, or sculpture consisting of 3-D configurations of cubes glued together.
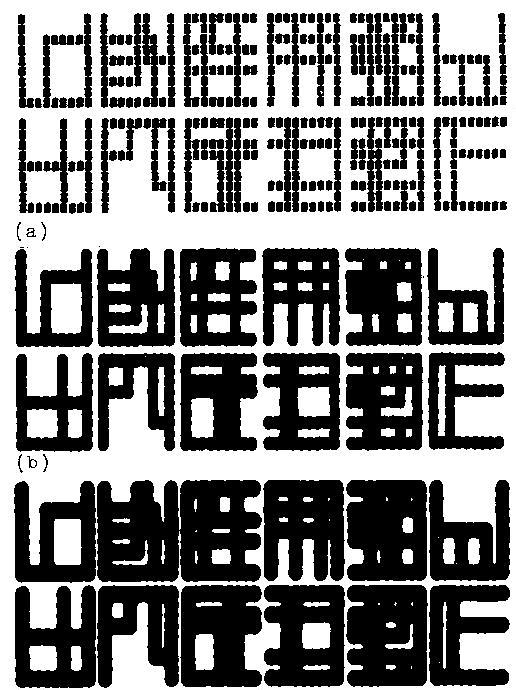
The reader should understand therefore that the figures of this paper, which are all first, second, or third generation photographs of the computer printout, are in many instances only the intermediate stages of some very colorful and delightful final products. Figure 1 demonstrates what can be done very simply by photography in order to achieve solid black areas from computer printout. In fact all of these prints were produced from the very same negative (using high contrast stock in both steps). They were produced by one focussed and 2 defocussed printing procedure, respectively . Each of the characters shown is a 9 × 9 array of blanks and overprinted M's, W's and $'s.
The largest single work, produced by a group of students, is shown in Fig. 2. It consisted of a photograph of an egg, quantized spacially into 88 rows of 77 units each, digitized in grey scale to 8 levels by eye, with the explanatory caption egg superimposed. It was rendered using microsymbols depicting eggs, bunnies, baskets, and other things having to do with Easter - the object being to replace each unit of the picture, in the manner of [Knowlton and Harmon, 1972], by a symbol having an appropriate number of black and white spots so that when viewed from far away the correct shade of grey is perceived for each unit area.

Some of the mathematically inclined students chose, quite naturally, to make designs based on mathematical formulae, Figure 3a and Figure 3b show two such examples, where in each instance a function of x and y is computed and reduced, module 3, in order to give values 0, l, or 2, which are rendered ultimately as black, grey, or white for each character position. The functions were [x3+Y3: 10] mod 3 and [ (x3-Y2): 10 mod 3, the x,y origin being at the center in both instances. In many cases surprising and intriguing results have come from relatively sinple algebraic expressions.


One of the more interesting homework assignments, from the pedagogical point of view, was one in which each of the students was required to devise a generator of characters of a new alphabet. Each character was to be contained within a 9×9 area, was to be totally connected by horizontal and vertical adjacency of spots, and the generator was required to be capable in principle of generating more than 1 million different characters. This exercise, and the class discussion of it, covered such matters as random walk, search with backup, heuristics, probability, and measures of similarity. Fig. 4a and Fig. 4b shows two different students' results, the first set of characters having been produced by a sequence of random walks starting from the center, and the second consisting of snakes drawn in such a way that the drawing position is never allowed to become adjacent to any previously drawn spot except the most recent one. Outputs such as these were used effectively in class discussions, where all students except the originator attempted to ascertain, by examining the result, what principles and probabilities were used.
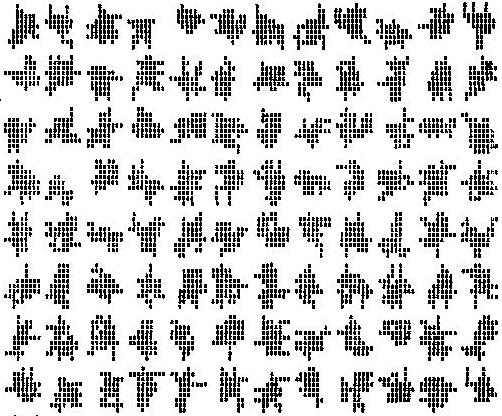

Fig. 5a and Fig. 5b shows two results of another homework assignment, this one requiring the students to depict cubes and rectangular solids as realistically as possible by a quasi-orthorgraphic projection. The second of these pictures demonstrates, incidentally, how effectively one can achieve a good grey scale on the line printer. It was done using a variation of the method of W. H. Huggins [Knowlton and Harmon, 1972].
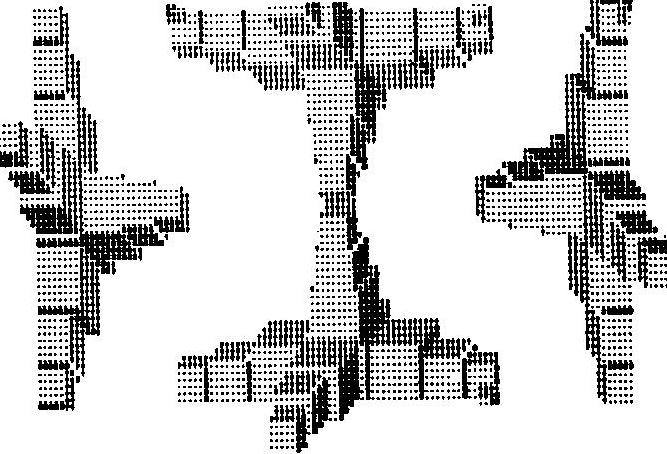

Fig. 6 is a design based on overlapping rectangles having randomly chosen heights, widths and positions; it was used as the basis for a beautiful deep-bite and aqua-tint etching.
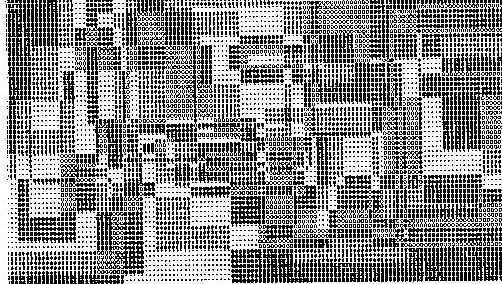
Fig 7a, Fig 7b, Fig 7c, Fig7d, is a set of four complementary designs which were used to produce matching photo silk screens. The composite design consists basically of contour-defined bands in a terrain consisting of superimposed octahedral mounds of randomly selected sizes and positions.


Finally, Fig 8a, Fig 8b, Fig 8c presents a variety of other results. The top picture was produced quite simply by random selection from these two basic modules for a square area:

The middle picture (Figure 8b) is also formed by random selection and adjacent placement of basic modules.
The bottom picture (Figure 8c) was made as follows: a terrain is produced by superimposing square truncated pyramids. Successive levels of the resulting topography are then coded into different shades of grey.

The bottom picture (Figure 8c) was made as follows: a terrain is produced by superimposing square truncated pyramids. Successive levels of the resulting topography are then coded into different shades of grey.

My conclusions from this experience are basically that this particular language is one in which even relatively inexperienced programmers can rather quickly produce designs that are interesting to them - it is therefore a situation in which there is a relatively high incentive to learn FORTRAN and, therefore, a great deal about computing in general. I did in fact find the art students to be very highly motivated, and they worked very hard on FORTRAN, which for them was essentially a separate course that they had to take simultaneously. Another conclusion, already stated, is the usefulness of the line printer as a graphic output device, particularly useful in conjunction with subsequent photographic and other processes.
A final and somewhat unanticipated result in my own thinking about the situation is this: almost everyone with normal vision is inherently visual and two-dimensional in outlook, ability, and faculty, whereas not everyone is numerically or mathematically endowed in intuition and ability. Therefore graphics is a very appropriate beginning point from which to approach computation, as well as the converse which is much more commonly presumed - that computing is a useful way to do graphics. An example may help to illustrate the point: consider the concept of a finite state machine making probabilistic state transitions, among those which are allowed, and emitting a particular character of some alphabet upon each such transition. As stated, this is a rather abstract idea. But now consider this particular form and purpose for such a device: The machine is to complete a scroll or frieze pattern, of indefinite length, by passing from left to right, at each stage supplying one of the permissible subsets of 5 connecting branches so that the final design will be connected but have no loops (i.e. become a minimal spanning tree), as shown:

Even though this situation is complicated, with 5 possible states of connectedness between top, middle and bottom rows to the left of the machine's position, and a total of 28 possible letters - 1.e. subsets of branches which may appear (not from every state!) - the student rather quickly grasps the idea because there is visual meaning to the pattern that is being drawn.
I want to express deep appreciation for the excellent work of Dan Ross, department programmer, who implemented this version of EXPLOR and designed its debugging; features, and thanks to my very enthusiastic and energetic students, among whom the following are to be credited for the various figures of this paper: Daniel Klein (Fig.1); Derek Jacobson, Daniel Klein, Lesley Payne, and Lynn Welge (Fig. 2); Ted Rainer (Fig. 3); Lesley Payne (Fig. 4a) and Edward Newman (Fig. 4b); John L. Maloney (Fig. 5a) and A. Steven Mohr (Fig. 5b); Mari Ik1 and Patrick H. Banwell (Fig. 6); Neil Brooks Fisher and Silvia Kwan (Fig. 7); and Mark Grossman (Figs. 8a, 8b) and Toby Cottfried (Fig. 8c).
The surface inside the computer is a 2- dimensional grid, each cell of which contains at any time a non-negative number from 0 thru 255. For card input and non-transliterated card or printer output, the first 63 of these numbers are expressed by single characters:
(Numbers greater than 62 cannot be input via cards in a simple way, though it is possible, by multi-punching card columns, to punch all of the characters and thus generate any number from 0 thru 255.)
All variables, unless otherwise stated here or explicitly declared otherwise by the user, are integers; in most cases where it seems meaningful, their values may be negative.
The dimensions of the grid are 240×320 squares:
Several subroutines perform operations on rectangular subareas; the first five dummy parameters in descriptions of these subroutines are written
( x, y, w, h, %, . . . )
with these meanings:
(Illegal or questionable values of parameters defining such rectangular areas will elicit warning comments in the printout, generally at decreasing frequency. The following conditions result in no operation: defined rectangle entirely off the surface, or zero or negative height or width.)
has the value (0-255) of the number stored at coordinates (x,y) on the surface. If (x,y) is off the represented surface, its value is -1.
has a randomly selected value from min thru max. Either or both may be negative, and they may be given in either order, but the range (i.e.|max - min| +1) may not exceed 401. If seed= 0, the generator of numbers continues from where it was; any other seed (1 < seed < 215) resets the generator in a particular way.
These are three functions which are defined only after the subroutine
CALL CENSUS(x, y, w, h)
has been invoked - a subroutine which counts all occurrences of each number in the specified area; the functions are not redefined until the subroutine CENSUS is called again. RANK (n) is the order of popularity of the number n - i.e. the most numerous number will have a RANK = 1, etc. If two or more numbers appear the same number of times, they will be given different ranks, the lowest number being given priority (the lowest rank). IDENT(rank) gives the identity of the number havinc the specified rank. For example, IDENT(2) has a value which is the second most numerous number on the surface. CUNT(n) is simply the number of times that n appeared in the specified rectangle the last time CENSUS was called.
CALL STASH (n, x, y)
stores the number n at coordinates x,y on the surface. (No operation if x,y is outside the represented area.)
CALL CARDIN (x, y, w, h, dont)
causes information from h cards to be read and stored left adjusted, one card per line, in the defined rectangular area, starting at the top. If w>80, the right end of the area is unchanged. The fifth parameter, dont, is a number which if read from the card, is not written on the corresponding square on the surface, leaving the previous value.
CALL PUNCH0 (x, y, w, h)
causes untransliterated (except for standard input-output conventions) card punching, one card per line. Cards are left-justified with respect to the defined internal surface; if w>80, the right end of the rectangle is not punched.
CALL PUNCH1 (x, y, w, h, table)
causes transliterated card punching, where table is an integer table of appropriate length initialized with appropriate characters. Thus if the only numbers on the internal surface are 0-5 and the user wants 0 to come out as blank and successive numbers to be punched as A, B, C, ., and $, then he should have defined an appropriate table, e.g.
INTEGER PTAB (6)/36,10,11,12,37,40/
Numbers greater than table length come out as garbage.
      CALL PRINT0 (x, y, w, h)
      CALL PRINT1 (x, y, w, h, table)
      CALL PRINT2 (x, y, w, h, table1, table2)
      CALL PRINT3 (x, y, w, h, table1, table2, table3)
Similar to PUNCH1 and PUNCH1, these cause printing, one line per line of rectangle height. PRINT0 does no transliteration ecept the standard input-output conversion; PRINT1, PRINT2 and PRINT3 cause printing according to the specified output transliteration table(s); in the latter two cases, the 2 or 3 lines so specified are overprinted.
CALL CHEKER (x, y, w, h, %, m, n)
fills the defined area - i.e. approximately the indicated percentage of the squares - with a checkerboard arrangement of the numbers m and n.
CALL ADDMOD (x, y, w, h, %, ad, md)
treats squares by adding ad to the number in each, and yielding the result module md. Thus . . . 3,6) adds 3 mod 6, which would change 2 to 5, 3 to 0, 4 to 1, etc.
CALL FLECK (x, y, w, h, %, min, max)
treats squares by filling them with random numbers selected from min thru max.
CALL XLITR8 (x, y, w, h, %, table)
causes a transliteration of numbers into other numbers, according to entries in a user-specified table of integers. Thus, if the surface contains numbers 0-10 and the user wants O thru 5 to stay as they were but 6-10 each to be doubled (to 12, 14, ... 20) then he provides a table like
INTEGER X5(11)/0,1,2,3,4,5,12,14,16,18,20/
CALL COPY (x, y, w, h, %, fx, fy, fw, fh, orient, dont)
causes a copy from the rectangular area specified by fx, fy, fw, and fh. If the from area is too large in either direction, it is effectively truncated to fit; if it is too small in any direction, the system uses modular repetitions of it after first asserting correspondence between lower left corner squares. Where the dont number is found in the from area, the corresponding target square is not changed. The parameter, orient, specifies one of eight (re) orientations of the material copied from (the copy-from area is not actually changed):
1,2,3,4: rotate 0°, 90°, 180°, 270° clockwise; -, -2, -3, -4: the same except first flip right-left
CALL LOCOP (x, y, w, h, %, min, max,neighbors, minval, maxval, table)
is a adjacency-conditioned transliteration according to the specified table. It may be read as follows: if between min and max (inclusive) of the specified neighbors are numbers at least minval but not more than maxval, then transliterate. The set of neighbors is some subset of the 8 neighboring squares plus the square itself - each row of three coded into an octal digit (0 to 7)
and the three such digits from top to bottom are concatenated into a decimal number. Thus the number which specifies the checked squares
CALL FRAME (alpha1, alpha2, integer, modlus)
Advances the output device (printer) to the next frame (page) and causes printing of identifying information consisting of the first three parameters (two 4-character alphanumeric strings and one integer) plus the frame number modulo the indicated modlus (for keeping track of color separation negatives, for example).
CALL NOWAT (id, param1, param2, param3, param4)
is used for debugging. NOWAT (now at) causes this trace point to be recorded along with current values of four integer variables or integer-valued expressions, param1 thru param4. id is an integer from 1 to 50 which identifies this point (or, possibly, set of points) in the program. Subsequently
CALL HISTORY
prints a history-of-execution table based on all WAT calls that have been executed, with one entry for each identifying integer that has been used, in the following format: