A method for producing half-tone pictures by computer is presented, The basic method, which is very simple, works well in most cases, but does not handle all objects correctly, The extended method, which copes with all cases, is also described. The functions used for calculating the intensity of parts of objects, and the method for handling transparency, are discussed, Examples of pictures produced by this method are included, and the times taken to generate them are tabulated. The extended algorithm compares favourably in speed and storage requirements with other published algorithms.
graphics, computer-aided design, computer art, curved surfaces, hidden-line, hidden-surface, visible-surface, half-tone, greyscale, shading, raster scan, video-disc
CR CATEGORIES: 3.41, 4.9, 8.2The computer production of shaded images is a further attempt to improve the realism of computer-produced pictures. This subject has received increasing attention in recent years and it has become apparent that images can be produced with an acceptable amount of computation.
The solution to the hidden-surface problem involves comparisons of chosen parts of the scene with other parts to determine those which are visible, Previous approaches have carried out these comparisons on a point by point basis [1], a scan-line basis [2][3][4][5], or on an area basis [6].
The approach described in this paper tackles the problem by identifying areas of complexity in the image, then resolving the difficulty by dividing the planar faces of the object until the difficulty has disappeared, Although no direct machine trials have been undertaken, it seems that this method compares favourably with other published methods. The cost of software methods is coming down, but it is probably true to say that the time taken to produce an image precludes the possibility of using shaded pictures in a truly interactive way in the design process.
The method outlined in this paper is relatively fast as a software approach, and has the advantage that a major part of the computational load can be offloaded onto a fairly cheap hardware device.
Input for the present implementation is a series of conceptually opaque quadrilateral faces. Although the faces are nominally planar, the algorithm will handle cases where the faces are slightly twisted, thus allowing approximations to curved surfaces to be handled.
Initially the object is transformed into the viewer's coordinate system, this being x horizontal and y vertical, the negative z axis being the line of sight. The transformed object is then clipped to remove any portion behind a plane placed just in front of the viewing point. After the half-space clip the object is further transformed into screen (or perspective) space, by applying a single perspective divide to each of the x,y and z coordinate values, The reason for working in 3D perspective space is to simplify many of the 2D and 3D tests involving pairs of faces.
At this stage, any face lying completely outside the viewing area is discarded. For a solid object, any face of the surface that faces away from the eye can be discarded, This simplification cannot be applied to surfaces that do not represent solids or closed shells. In all cases faces that are viewed edge-on can also be rejected. The resulting object description is processed by the main body of the hidden surface procedure.
The approach to be described centres around a screen map, which may be considered as a software simulation of a digital video disc. The screen map holds sufficient information to determine the intensity of every raster point in the image. Portions of the object are written to the screen map in an ordered manner such that those faces furthest from the eye are written first, the map being successively overwritten by each succeeding face.
An advantage of this method over most others is that if the correct relative ordering of groups of faces is known, then only one group need be handled at a time, The overwriting capability of the screen map handles the obscuring of one group by another, Using this method, scenes can be produced containing many more faces than can be held in core at once.
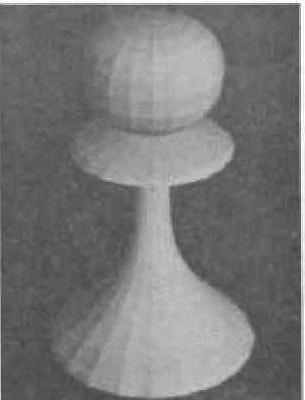
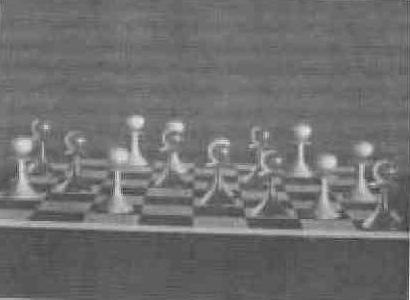
Figure 1 shows an example of the use of this technique. There are 10,870 faces in the scene, whereas the program considered only one pawn of 720 faces at any one time. The ordering of groups of faces is at present done manually, though in some cases it could be automated.
An early implementation of the algorithm takes the planar faces of the object, orders them according to the z coordinates of their centroids and then writes them to the screen map in this order. This approach is remarkably simple to implement, but although the resulting algorithm is fast it is not able to solve all cases correctly. The correct order for writing faces does not necessarily depend on the position of the centroids; in such cases a more elaborate scheme is required to find the ordering. Worse cases arise when no ordering exists to solve the hidden-surface problem correctly. This happens when faces intersect, or obscure one another cyclically. However this approach hes the advantage of simplicity, and it has been found that it caters for a large class of objects. It works well when the object consists of a large number of small quadrilateral faces. The basic method has been extended to cater for the failing cases.
The simple algorithm described above was augmented by providing a control section to order the faces correctly and split those faces that cause problems in the ordering. The flowchart in Figure 1 gives a broad outline of the augmented procedure. Prior to entering the procedure certain frequently-used data items are computed and stored in linear arrays. These data items consist of such things as plane equations in screen space, and extremum values of x and y on the screen. In addition to these, an ordered list is initialised to contain references to faces in decreasing order of their minimum z values. The minimum z value of the face corresponds to the point furthest from the eye. The face at the top of the list has a good chance of not obscuring any other, and so it is potentially the first face to be written to the screen map. Whenever a face is written to the screen map it is removed from the top of the list and is no longer considered. However the current top face in the list, P, must first be checked against each face, Q, that could possibly be obscured by P. Such faces are those whose furthest point is further from the eye than the nearest point of P. This usually involves only a small proportion of the total number of faces in the scene, and since the list is ordered on minimum z value these always appear at the top of the list.
The comprehensive routine that tests whether P can definitely be written to the screen map before Q answers the question does P obscure Q. This consists of a sequence of tests of increasing severity, the result of which is either a definite negative answer or an indication of failure to prove a negative answer, in which case there is a possibility that a part of P obscures Q.
In the event of failure the program investigates the possibility of writing Q to the screen map before P, thereby forcing Q out of the previous ordering to the top of the list. This attempt is only permissible if Q has not been forced out of order previously, otherwise the program could loop interminably. The test for writing Q before P is very similar to the test for writing P before Q and can utilise some of the intermediate results of the former test. If it can be proved that Q does not obscure P, then Q is moved to the top of the list and marked. The list is collapsed to fill the gap created.
Should the attempt to reorder Q fail, the program enters a face-splitting procedure that slices P or Q into two pieces and then inserts the resulting fragments in their correct positions in the list, according to their minimum z values.
An earlier implementation of the extended algorithm entered the face-splitting routine without any attempt to reorder faces. This worked well for many cases, but occasionally the program would split faces into smaller and smaller pieces without sorting out the difficulty until fragments the size of raster points resulted. Such cases were considerably improved by the reordering enhancement, and in all examples tested it led to an improvement in computation time.
The routine that tests whether it is permissible to write face P to the screen map before Q must be made as efficient as possible, since it will be entered frequently for all faces in the object. In the current implementation the following sequence of tests is made. Although they are not the only set of tests that could be devised, they have been designed so that the program can exit after a minimal amount of computation. As mentioned previously, the routine answers the question does P obscure Q?, and exits with a negative answer should any of the following tests be satisfied:
(Any face divides space into two half-spaces, and the front half-space is defined to contain the eye.)
Should all five tests fail then it is still possible that the ordering is satisfactory, but the further computation needed to prove this conclusively is considered unjustified. Hence in these circumstances the program assumes that P obscures Q. In the event of failure then only the equivalent of tests 3 and 4 need be repeated for the converse test for writing Q before face P. If it is shown thet Q does not obscure P, and Q has not been previously displaced, then it is moved to the top of the list and marked. This new top member of the list is now treated as the new P.
If all attempts to find a correct ordering of a pair of faces fail, then either face P or Q (not both) is sliced in two in the hope that reducing the face size will enable an ordering of the resulting fragments to be found. The procedure is as follows:
After one face has been split, the resulting fragments and the other unsplit face are inserted in their correct positions in the list, this being below any marked faces which have been previously forced out of order to the top of the list. Again, as in the case of the ordering tests, this splitting strategy is not the only one possible.
The basis of this whole method of solving the hidden-surface problem is the screen map with its overwrite capability. This occupies most of the time used in producing an image, As mentioned earlier, only very simple logic is required to implement a restricted hidden-surface routine that will work for a large class of cases; the very nature of the screen map solves the hidden-surface problem.
In the first implementation of the screen map, 3 bits are held for each raster point on a grid of 256 by 256. Hence pictures are limited to 8 intensity levels, and the resolution is poor. If one tries to improve the situation by increasing the resolution and using more intensities, then the escalation in storage requirements becomes excessive. For example the original screen map occupies 4k of 48 bit words on the ATLAS 2. Doubling the resolution and allowing 16 intensities would increase this to about 21k. Thus an alternative approach has been used that does not require such a large amount of store.
The second implementation consists of a buffer area that holds a string of data beads. Each bead holds the list of line segments for a particular raster line, and the beads are accessed via a directory based on the y values of the raster lines. When a new face of the object is to be written to the screen map, it is first processed into horizontal line segments at the required intensity. When one of these line segments is added to the screen map, its corresponding raster line bead is copied to the top of the buffer area, simultaneously merging the new line with line segments already there. Thus the raster line pointer has to be updated and the original bead nullified, When the buffer area gets filled, which in some cases can be frequently, the program enters a simple garbage collection procedure to remove the nullified beads, Investigations were made into methods of reducing the amount of garbage collection required, and although large reductions were achieved, the net result was to increase the overall computing time, and so it transpires that the simple approach is the best yet found.
The algorithm, considered as a software method, could be regarded as a scan-line method with a preprocessor that allows the logic to solve the 2D hidden-line problem on each scan-line to be greatly simplified, In fact, extensions along these lines are the subject of current investigations. The idea is to produce a list of faces and face fragments which, if written to the screen map in order, would produce the correct picture. A back end consisting of a much simplified scan-line method could then be used to produce the picture. Intersections and orderings would thus be handled on a face by face basis, thereby improving line to line coherence. It is hoped that an improved performance will be achieved by this method.
The device used at the CAD Centre for displaying shaded pictures is a PDP9 computer with 340 display unit. The PDP9 is an 8K machine and the 340 is capable of displaying approximately 2000 inches of line per second. In order to display a shaded picture, the screen map is converted (in ATLAS) into a compressed format display file that is processed interpretively by the PDP9 for display on the 340. The compressed format allows three horizontal line segments to be held in two PDP9 18 bit words. The DEC 340 display has been enhanced to 64 intensities, thus 6 bits are used to define the intensity of a line segment, and 6 bits are used to hold its length. To overcome the limited speed at which the 340 can display lines, the picture can be interlaced. Raster lines are not displayed in order of increasing y value. In the case of a picture of 512 raster lines, the nth raster line displayed has a y value of (n.p)modulo 512, where p is prime to 512. In practice a value of p of 97 has been found to give good results, in some cases nearly freezing the picture, For the purposes of taking photographs, the picture is displayed an integral number of times while the camera shutter is open, thereby ensuring that all parts of the film are exposed for an equal amount of time.
Several authors [3],[6],[7] have discussed methods of computing the intensity of a particular face of the object for a given light condition, Usually the problem is limited to cases where the light source is at the eye and a uniform mean intensity is computed over the whole face. One of the reasons for this restriction is to avoid the complexity of solving the shadow problem, However, interesting effects can be obtained with oblique lighting even if the shadow problem is ignored. The most interesting objects to investigate with different lighting functions are those that consist of a large number of small faces derived from some curved surface definition. The large number of differing orientations arising in the scene lead to interesting reflection patterns, For instance, consider the simple intensity function
where r is the intensity range, n is some arbitrary power, a is some measure of the angle between the incident light and the face normal and b is the ambient level of lighting.
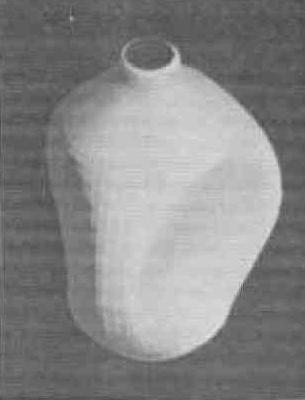
For n=1 this function simulates diffuse reflection, but if n is increased to a high value, say 20, then this leads to most of the object appearing dark, with a few critical faces appearing at the brightest intensity, This gives the effect of a black shiny object.
Observations in the real world show that many curved surfaces, for example bottles and other solids of revolution, are characterised by having longitudinal reflection patterns. This effect is easily simulated by having a component in the lighting function of the form
where again m is a high power. In this case the brightest faces appear where the light is nearly tangential, which in the case of a bottle produces a white streak right down the side of the bottle.
A third effect that picks out the silhouette of a dark object has been used. This is done by having a light source of the sine type at the viewing point.
Transparent materials can be simulated by using a small extension to the screen map routine, When a line segment is to be added to the map, instead of completely overwriting the map, some function of the intensity of what it would obscure and of its own intensity is used. The form of this function determines the apparent transparency of the material, The function used at present defines the resulting intensity, I, as:
Where I1 and I0, are the intensities of the new and obscured line segments respectively, and w is a weighting factor.
These functions do not attempt to simulate the real world, though a judicious use of them can considerably enhance the appearance of some objects, Examples of various combinations of these effects can be found in the accompanying illustrations.
Waetkins [4] has classified published hidden-surface algorithms according to three criteria; deterministic or non-deterministic, area subdivision or scan-line subdivision, and object space or sample space, It is relevant to see where the current algorithm fits into this classification.
The non-deterministic front end of the current algorithm works in object space and is also of the area subdivision type, The fundamental difference from Warnock's approach is that area subdivision is carried out on the planar faces of the object in an intelligent manner, instead of on areas of the screen in a fixed manner, However, the deterministic back end, namely the screen map, works in sample space on a scan-line basis.
The present algorithm has not been directly tested against any other published methods and so accurate assessments cannot be given of the performance relative to these methods. The current implementation is written wholly in FORTRAN except for the screen map routines, which are written in machine code. The program runs in 24k of core in ATLAS 2 and up to 800 faces and 1000 points can be accomodated in this core space, The time taken to produce an image can be broken down into four parts as follows:
1. Object transformation, preliminary data calculations and initialisation of ordered list.
2. Preparation of faces for the screen map including ordering tests and face splitting.
3. Writing of faces to the screen map.
4. Conversion of screen map into compressed format display file.
Items 1 and 4 make a relatively insignificant contribution to the total computation time, usually taking less than 2 seconds, The time taken for item 2 is largely dependent on how good the initial ordering is. If few faces intersect then this time is usually short, but cases can arise where it becomes significant.
Item 3 takes most of the time, and clearly this is a part of the algorithm that can be isolated and implemented with fairly cheap hardware, However, the software method used still makes this approagch to the hidden-surface problem a feasible proposition.
The table in Figure 2 gives a breakdown of the times taken for a series of test objects, For comparison with other machines, it is estimated that equivalent FORTRAN programs take 3 times longer on ATLAS 2 than on a UNIVAC 1108. A11 times quoted in the table are based on a picture of 512 by 512 raster points.
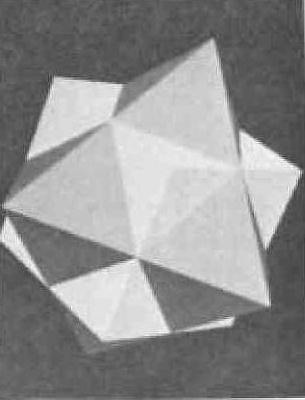
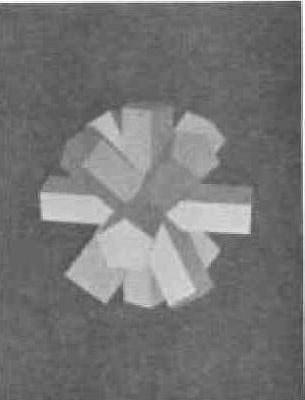
Figure 3 shows a cube and an octahedron intersecting, The intersections were handled completely by the program. This picture illustrates the program's capability of assigning different material functions to parts of an object. Up to six different materials can be specified.
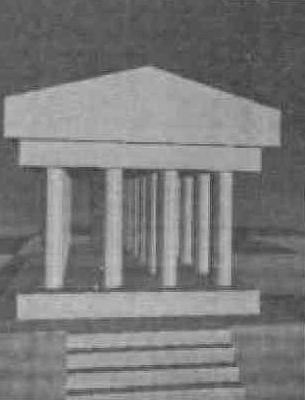
Figures 4 to 7 are included for comparison with similar objects given as examples in previous papers. Figure 4 is taken from Bouknight [5], and Figure 5 and Figure 7 are from Watkins [[4].
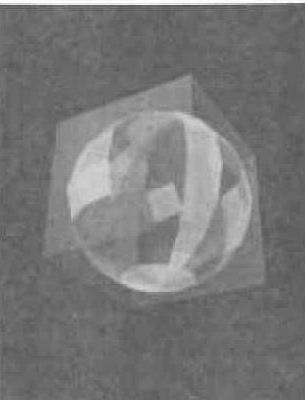
Figure 6 shows the same object as Figure 5, rendered in a transparent material.
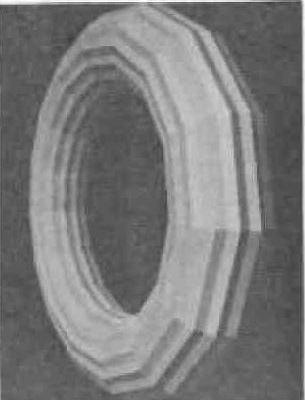
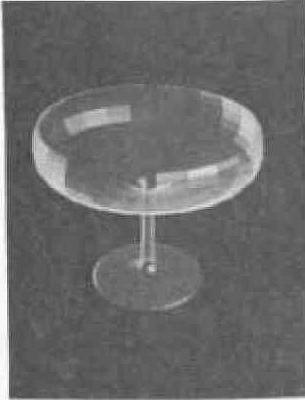
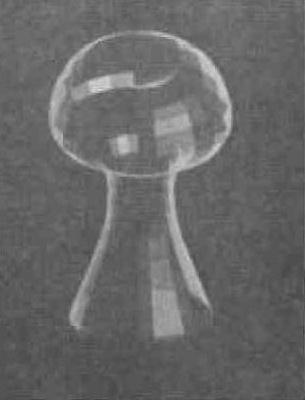
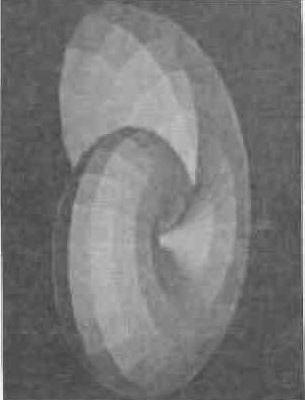
Figure 8, Figure 9 and Figure 10 are examples of objects designed with a solids of revolution program.
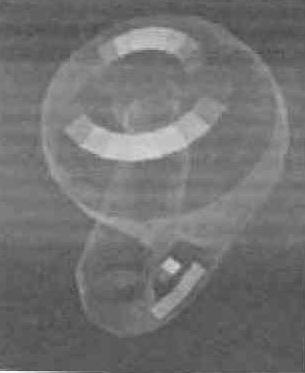
Figure 11 is an example of an object generated with THINGS [8]. It is necessary to consider all but the edge-on planes in this object, because it is not a solid.
Figure 12 is another object generated with THINGS. The picture was generated on its side since the horizontal complexity is far greater than the vertical.
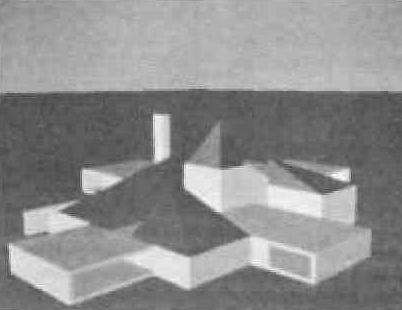
Figure 13 shows a representation of a crematorium modelled using THINGS.
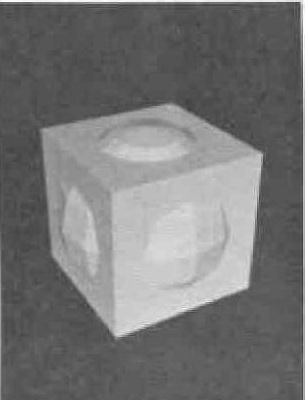
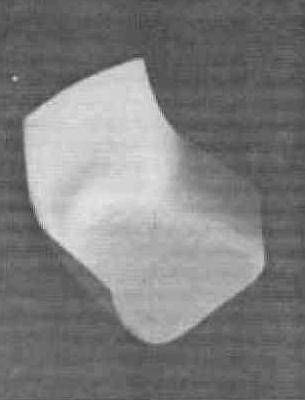
Figure 14, Figure 15, Figure 16, and Figure 17 are further examples of output from the program. Figure 14 and Figure 15 were designed using bi-cubic patches.
Any department that invests time developing a shaded picture facility should show that the result is not merely a sophisticated paint brush with relevance only to the cosmetics of CAD, For this reason effort has been devoted to evolving a generalized input system for the production of shaded pictures using the results of design programs as input [9]. The central part of this input system is THINGS - THree dimensional INput of Graphical Solids. THINGS is implemented as a set of subroutines that can be called from a user's FORTRAN design program. The function of this package is to enable a user to assemble objects at different positions and orientations in space and store these on a file for future use by the shaded picture program, This system is capable of taking object definitions from a number of sources, including two surface design systems, a highway design system, and a solids of revolution design system, together with standard objects such as prisms, spheres and boxes.
One of the main potential uses of shaded pictures is in the assessment of the aesthetics of a new piece of architecture or a proposed product. This potential has not yet been realized, although the cost of producing a sequence of views from one object definition is cheap.
Another application is data verification. Small errors in objects defined with curved surfaces often become blatantly obvious in a shaded picture, despite the approximation by planar faces. An example of such an error occurs when two surfaces unintentionally intersect, such as a car engine fouling the body. This type of error is very obvious in a shaded picture. Another error is the existence of ridges or grooves in a surface. Although at every quadrilateral face boundary there is a discontinuity in the slope of the approximated surface, it is surprising how obvious discontinuities in the riginal definition can be. Errors of this nature have already been found by using shaded pictures.
A number of methods of solving the hidden-surface problem now demonstrate that a variety of pictures can be produced economically. The main area of use seems to be in the final stages of computer-aided design. A further reduction in cost is needed before shaded pictures can become fully integrated with the design process itself.
The method described in this paper compares favourably both in speed and storage requirements with other published methods. An advantage of the method lies in the fact that a large part of the computational load can be removed by using a hardware screen map. This device could be either a digital video disc or a solid state memory.
| FIGURE | Complexity | TIME SPENT (SECS) | ||||||
|---|---|---|---|---|---|---|---|---|
| TOTAL FACES | FACES CONSIDERED BY PROGRAM | FACE FRAGMENTS WRITTEN TO SCREEN MAP | LINE SEGMENTS IN PICTURE | TRANSFORMING AND INITIALISING | ORDERING AND SLICING FACES | WRITING FRAGMENTS TO SCREEN MAP | CONVERTING SCREEN MAP TO DISPLAY FILE | |
| 3 | 14 | 7 | 18 | 2431 | 0.1 | 0.2 | 1.4 | 1.2 |
| 4 | 225 | 106 | 410 | 5474 | 0.7 | 10.6 | 10.6 | 1.8 |
| 5 | 140 | 62 | 158 | 3860 | 0.2 | 3.9 | 8.6 | 1.6 |
| 6 | 140 | 140 | 409 | 7197 | 0.6 | 12.6 | 33.4 | 2.4 |
| 7 | 63 | 27 | 449 | 3258 | 0.2 | 27.0 | 12.0 | 1.3 |
| 8 | 625 | 599 | 600 | 7182 | 2.8 | 6.2 | 14.8 | 2.4 |
| 9 | 625 | 625 | 626 | 6333 | 3.0 | 6.4 | 12.4 | 2.2 |
| 10 | 720 | 406 | 408 | 4503 | 2.5 | 3.2 | 5.7 | 2.0 |
| 11 | 450 | 444 | 444 | 4224 | 2.1 | 3.5 | 14.5 | 1.5 |
| 12 | 393 | 180 | 180 | 7107 | 1.3 | 1.1 | 9.8 | 2.5 |
| 13 | 195 | 98 | 118 | 2532 | 0.6 | 1.5 | 4.4 | 1.6 |
To R M Williamson for designing and implementing the display routines enabling the production of the pictures on an 8K PDP9 with 340 display.
1. Appel A,On Calculating the Illusion of Reality, IFIP68.
2. Wylie C, Romney G, Evans D C, Erdahl A, Halftone Perspective Drawings by Computer, FJCC67.
3. Romney G W, Computer Assisted Assembly and Rendering of Solids, RADC Contract AF30(602)-4277.
4. Watkins G S, A Real Time Visible Surface Algorithm, UTECT-csc-70-101, University of Utah, June 1970.
5. Bouknight W J, A Procedure for Generation of Three-Dimensional Half-toned Computer Graphics Presentations, CACM Vol 13, 9, September 1970.
6. Warnock J E, A Hidden Surface Algorithm for Computer Generated Halftone Pictures, RADC-TR-69-249, University of Utah, 1969.
7. Gouraud H, Continuous Shading of Curved Surfaces, IEEE Transactions on Computers, Vol. c-20,6, June 1971.
8. CAD Centre, Cambridge, England, THINGS - THree dimensional INput of Graphical Solids.
9. Newell M E, Newell R G, Sancha T L, The Economic Application of a Half-tone Picture Generating Algorithm, Computer Aided Design, IEE Conference Publication 86, Southampton April 1972.